Messy Data.
Missed Opportunities.
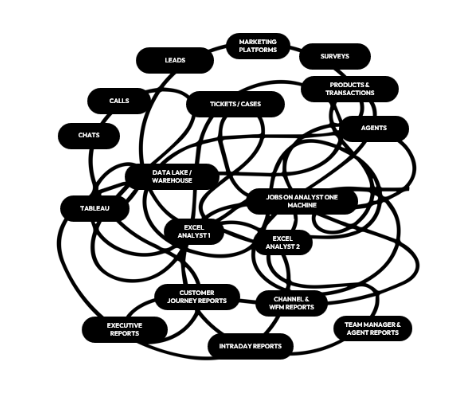
Most organizations run their customer journey across ten or more disconnected systems. Every report request spawns a one-off pipeline. No two analysts build it the same way, and no one can maintain what someone else built. When a source system changes, the pipeline breaks and the data goes stale.
The deeper problem is trust. The same metric calculated in three places produces three different answers. Every meeting starts with a data debate before anyone gets to the actual decision. Leaders stop relying on the numbers because the numbers have let them down before.
The result is a business that is always one analyst departure away from flying blind. The knowledge lives in people, not the platform. When they leave, everything they learned about the business leaves with them.
Perch was built for exactly this problem.
One source of truth for your entire customer journey.
Most organizations run their customer journey across eight to twelve disconnected systems. No two of them agree on the same number. Every analysis starts with a reconciliation meeting before anyone can ask the actual question.
Perch builds and maintains a unified data model that joins every source into one governed warehouse. CRM, dialer, CCaaS, marketing, billing, and WFM data all flow into a single record of every customer interaction, every campaign result, and every agent activity. One number. One answer. No debate about whose spreadsheet is right.
Perch owns the pipelines, the maintenance, and the data quality end to end. When a source system changes, Perch handles it. Your team never touches the infrastructure.
1,000+ metrics, built by experts, mapped to your business.
Raw data is not intelligence. A warehouse full of tables and columns is only useful when every metric is defined precisely, consistently, and in the language your business actually uses.
The Perch Semantic Layer contains over 1,000 expert-built metrics and dimensions mapped to every stage of the customer journey. Lead quality. Conversion. Contact rate. Agent performance. Retention. Every metric is defined once, governed centrally, and used by every team. The data debate ends before it starts.
Because Perch built and maintains the semantic layer, your analysts are not spending cycles on definitions. They are spending them on decisions.
An AI that knows your business, not just your numbers.

A generic AI will give you generic answers. It can tell you that conversion dropped. It cannot tell you whether that drop is normal for your Q1 seasonality, which vendor is responsible, or whether it matches the pattern you saw in March of last year.
The Company Context Manager is what makes the Perch Guide domain-specific to your operation. Your org chart, performance benchmarks, KPI targets, agent tiers, campaign structures, and playbook rules all feed the AI continuously. When context changes, the model updates. The Guide always understands your business the way your best analyst does, without turnover risk.
This is what separates Perch from any generic AI product. The intelligence is not just about data. It is about context.
Always analyzing. Always there to answer.
The signal finds you.
Perch monitors your entire operation around the clock. The moment something moves outside expected range, The Guide surfaces it. You do not have to know the right question to ask. Mission Control tells you where to look.
Plain language in. Answers out.
When you do have a question, type it in plain language. The Guide already has the data, the context, and the analysis. The answer comes back in seconds, with cited evidence, root cause, and a clear direction. Not a chart. An answer.
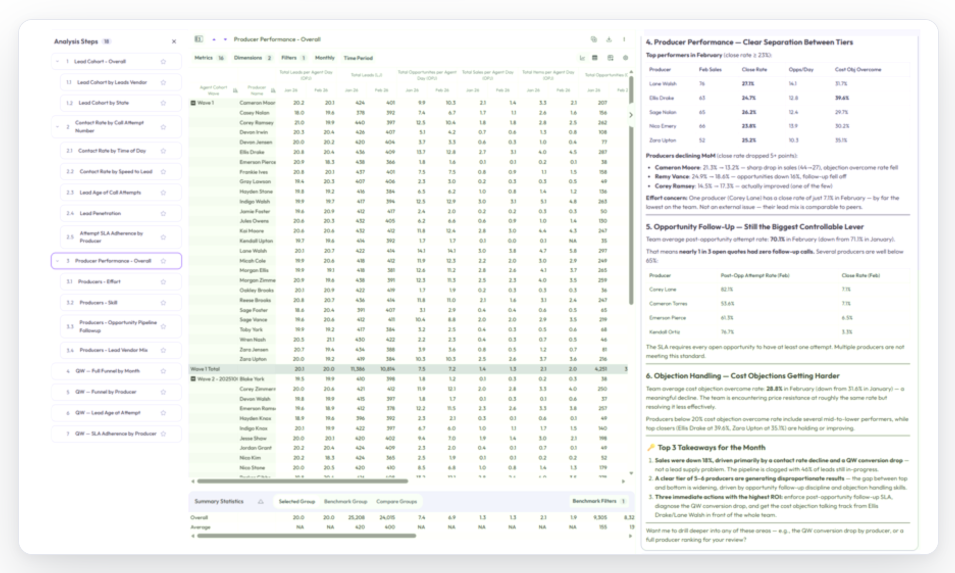
The anatomy of a complete investigation.
Some questions are too important to answer with a single data pull. A complete investigation moves through layers: what changed, where it changed, why it changed at that level, and what to do about it.
Threads are structured, step-by-step analytical workspaces that let you or the Perch team build the full anatomy of an investigation. Every data source in the platform is available. Every metric, dimension, filter, and comparison can be layered in at any step. The analysis evolves as the evidence does.
Every Thread is repeatable. Run the same investigation next quarter with one click. Every Thread is shareable. Walk your leadership team through the exact evidence that led to the decision. The work lives in the platform, not in someone’s head.
This is how Perch replaces the analyst queue. Not by making questions faster to answer, but by making the entire investigation a governed, institutional asset.
The experts behind the platform.

Perch is a fully managed platform. That means a dedicated team of Perch analysts and customer journey specialists is embedded with your operation every month.
Ongoing metric development, model improvements, and dashboard enhancements scaled to your engagement. Your data infrastructure gets better every month without your team touching it.
Expert insight reviews and executive-ready analysis. The Perch team is not just running the platform. They are reading the data alongside you, flagging what matters, and preparing the analysis your leadership needs before the QBR.
When institutional knowledge is in the platform and in the Perch team, it does not leave when an analyst does.
Intelligence wherever your business runs.
Perch is a platform, and it is also an intelligence layer. Every insight, every metric, every answer The Guide produces is available via the Perch API. Ready to be consumed by humans and AI agents alike.
Perch is built agent-first. Your AI agents, copilots, and automated workflows can call the same governed metrics, evidence, and Threads your analysts use, with structured JSON, citations, and confidence scores in every response. No hallucinated numbers. No bespoke pipelines per agent. The semantic layer is the contract.
Push conversion alerts into Slack. Surface agent performance scores directly in your CRM. Embed Perch dashboards in your own product. Trigger autonomous workflows on the signals Perch detects. Your developers and your agents get the same clean REST API.
The intelligence Perch produces should be available everywhere decisions are made. By humans, by agents, by the systems running your business.